Huzi610.github.io
CARUSO Metric
Other Links
Socials
Table of Contents
Original distributions
NBA Fantasy: A source of pure joy and stress for most of us. If you’re reading this, it means you’re deep into it, and you probably know that there are two types of NBA Fantasy leagues: points and categories. Categories typically require more strategy and planning, making them the more popular choice, with the most popular being 9CAT league.
The categories are
- Points
- Three pointers
- Rebounds
- Assists
- Steals
- Blocks
- Turnovers
- Field goal percentage
- Free throw percentage
For the past 30 years or so, the golden standard for NBA fantasy category rankings has been the Z-score. Every year, we draft, rank, and evaluate players based on their Z-score ranking. But have you ever questioned how that rank is calculated? Probably not, just like myself.
I was listening to Josh Lloyd’s podcast, where he was discussing how the Z-score is calculated. It essentially assumes that the data distribution is Gaussian or Normal. I thought to myself, well, almost everything becomes normally distributed when the sample size is large enough, and in the NBA, we’re dealing with thousands and thousands of shots, steals, blocks, and more.
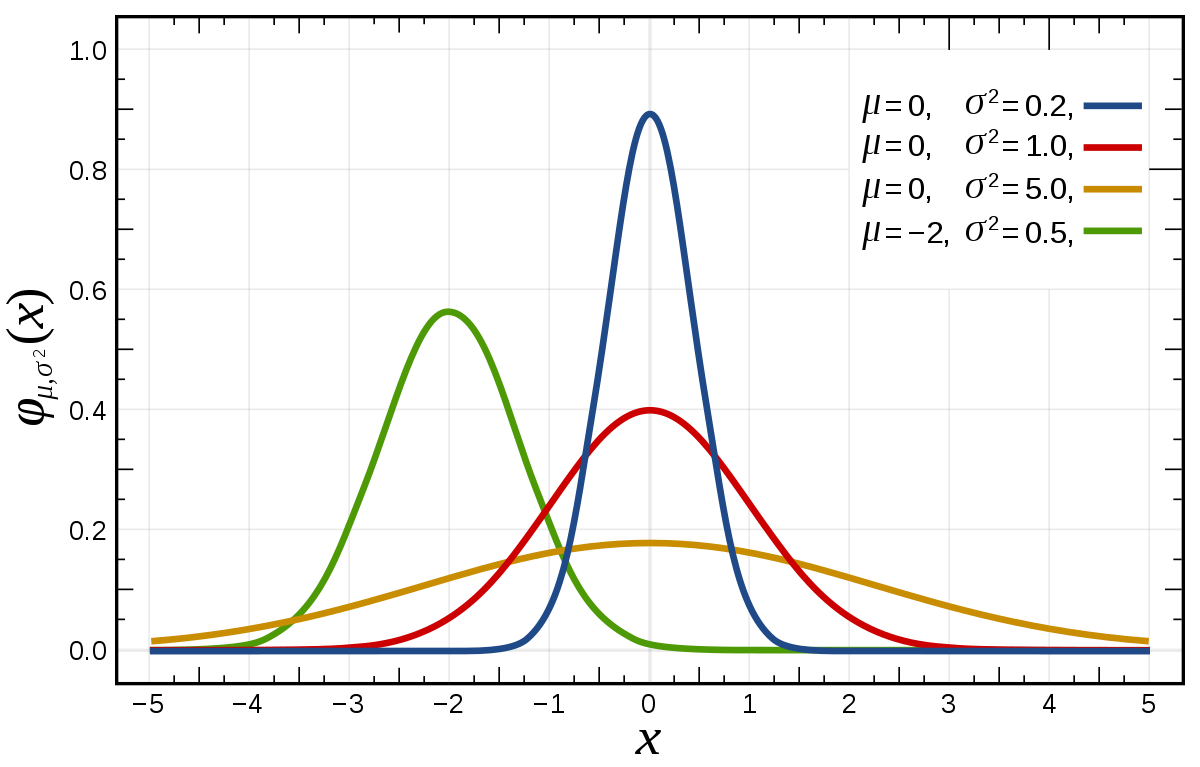
Z-score is being calculated with the following formula:
Z = (X - μ) / σ
Where:
- Z is the Z-score,
- X is the value you want to standardize,
- μ is the mean (average) of the data,
- σ is the standard deviation of the data.
and the data is the values from all players for a specific category.
Okay, sounds good for now, but Josh said that the data is not normally distributed. I can’t trust him blindly, so I decided to plot the main 9 categories for all top 180 players based on the traditional Z-score from the 2013/14 to the 2022/23 season, along with their distributions.
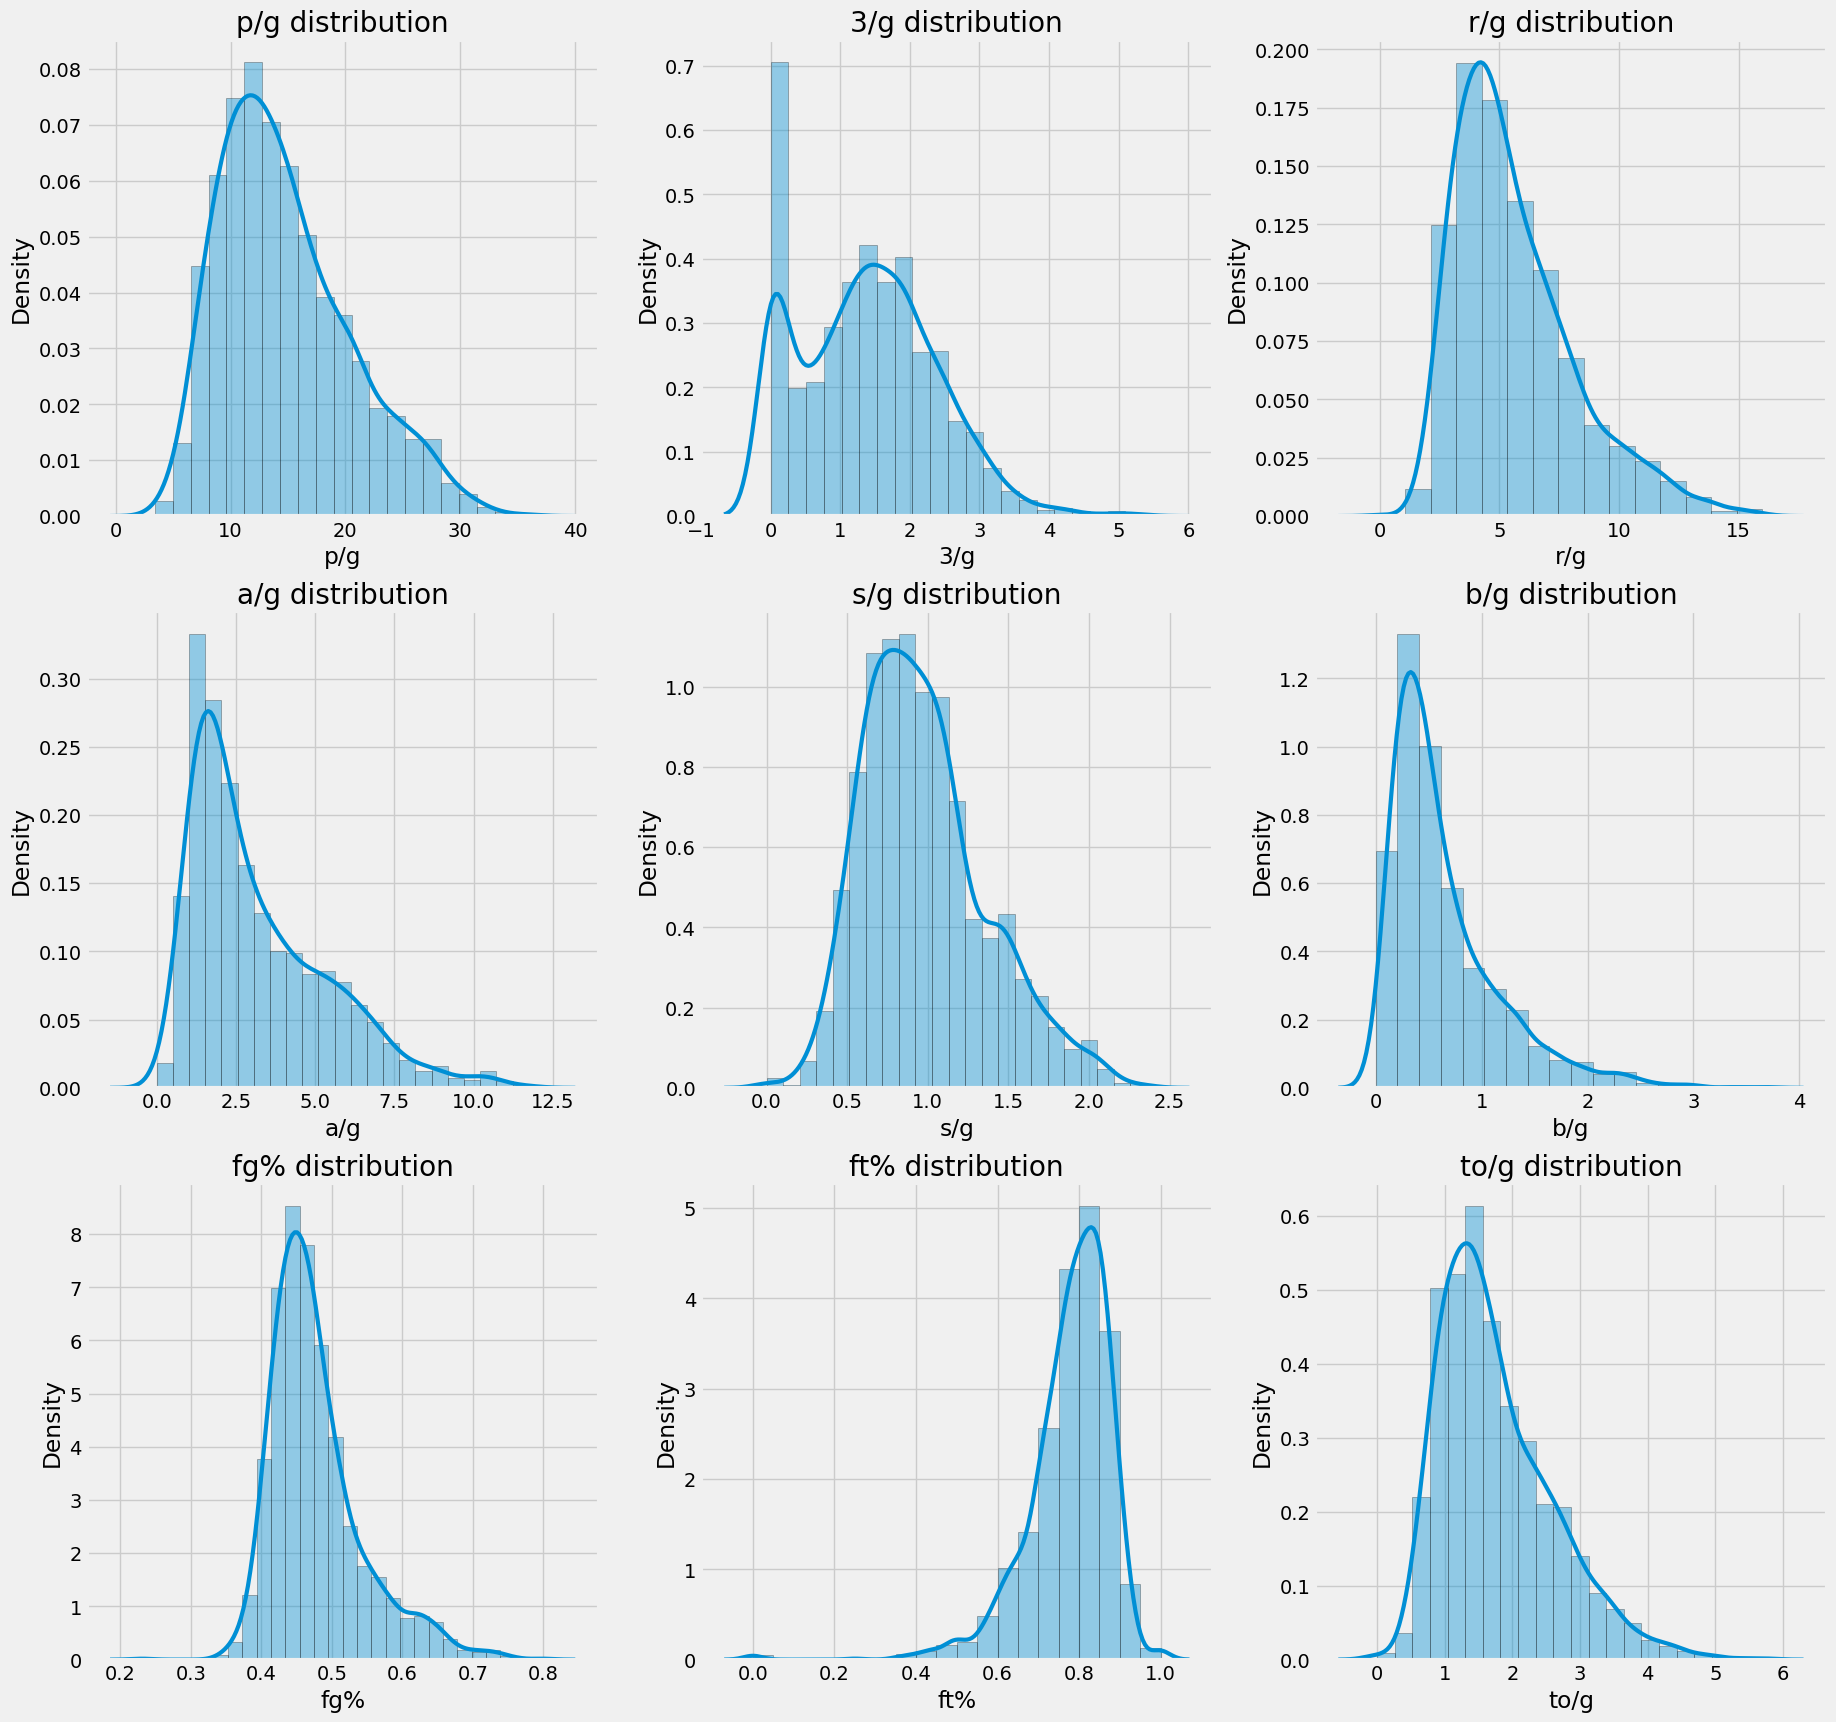
Well, well, it looks like he was right all along. None of this data resembles a Gaussian distribution. Maybe the Z-score isn’t the best metric available. Perhaps that’s why players like Delon Wright, Al Horford, and De’Anthony Melton had a higher rank than the 2x MVP Giannis Antetokounmpo in his highest-scoring season last year.
By the way, there’s a really interesting tweet by Josh:
JJJ had a z score of 4.64 for blocks category last season. In a normally distributed set of data, someone being that far above is a 1 in about half a million proposition.
— Josh Lloyd (@redrock_bball) August 14, 2023
A player that averages 3.0 blocks per game should be THAT rare. There have been plenty of players in the past who have averaged even more. This could be the biggest inspiration for CARUSO.
Idea for CARUSO
Inspired by one of my favorite, and also one of the most underrated players in the league, I’ve coined the name CARUSO metric, which stands for:
- C - Customized
- A - Adaptive
- R - Resourceful
- U - Unique
- S - Statistical
- O - Optimized
CARUSO is based on the H-score (instead of the Z-score). Similar to the classical approach, it calculates a score for each category and then takes the average across all categories, yielding the final CARUSO value. CARUSO also employs a machine learning algorithm to determine the best distribution and its parameters, aiming to minimize the mean squared error on the data.
Once the optimal distribution is identified, the H-score can be calculated for every data point within it, involving basic statistics and mathematics.
CARUSO Interpretation
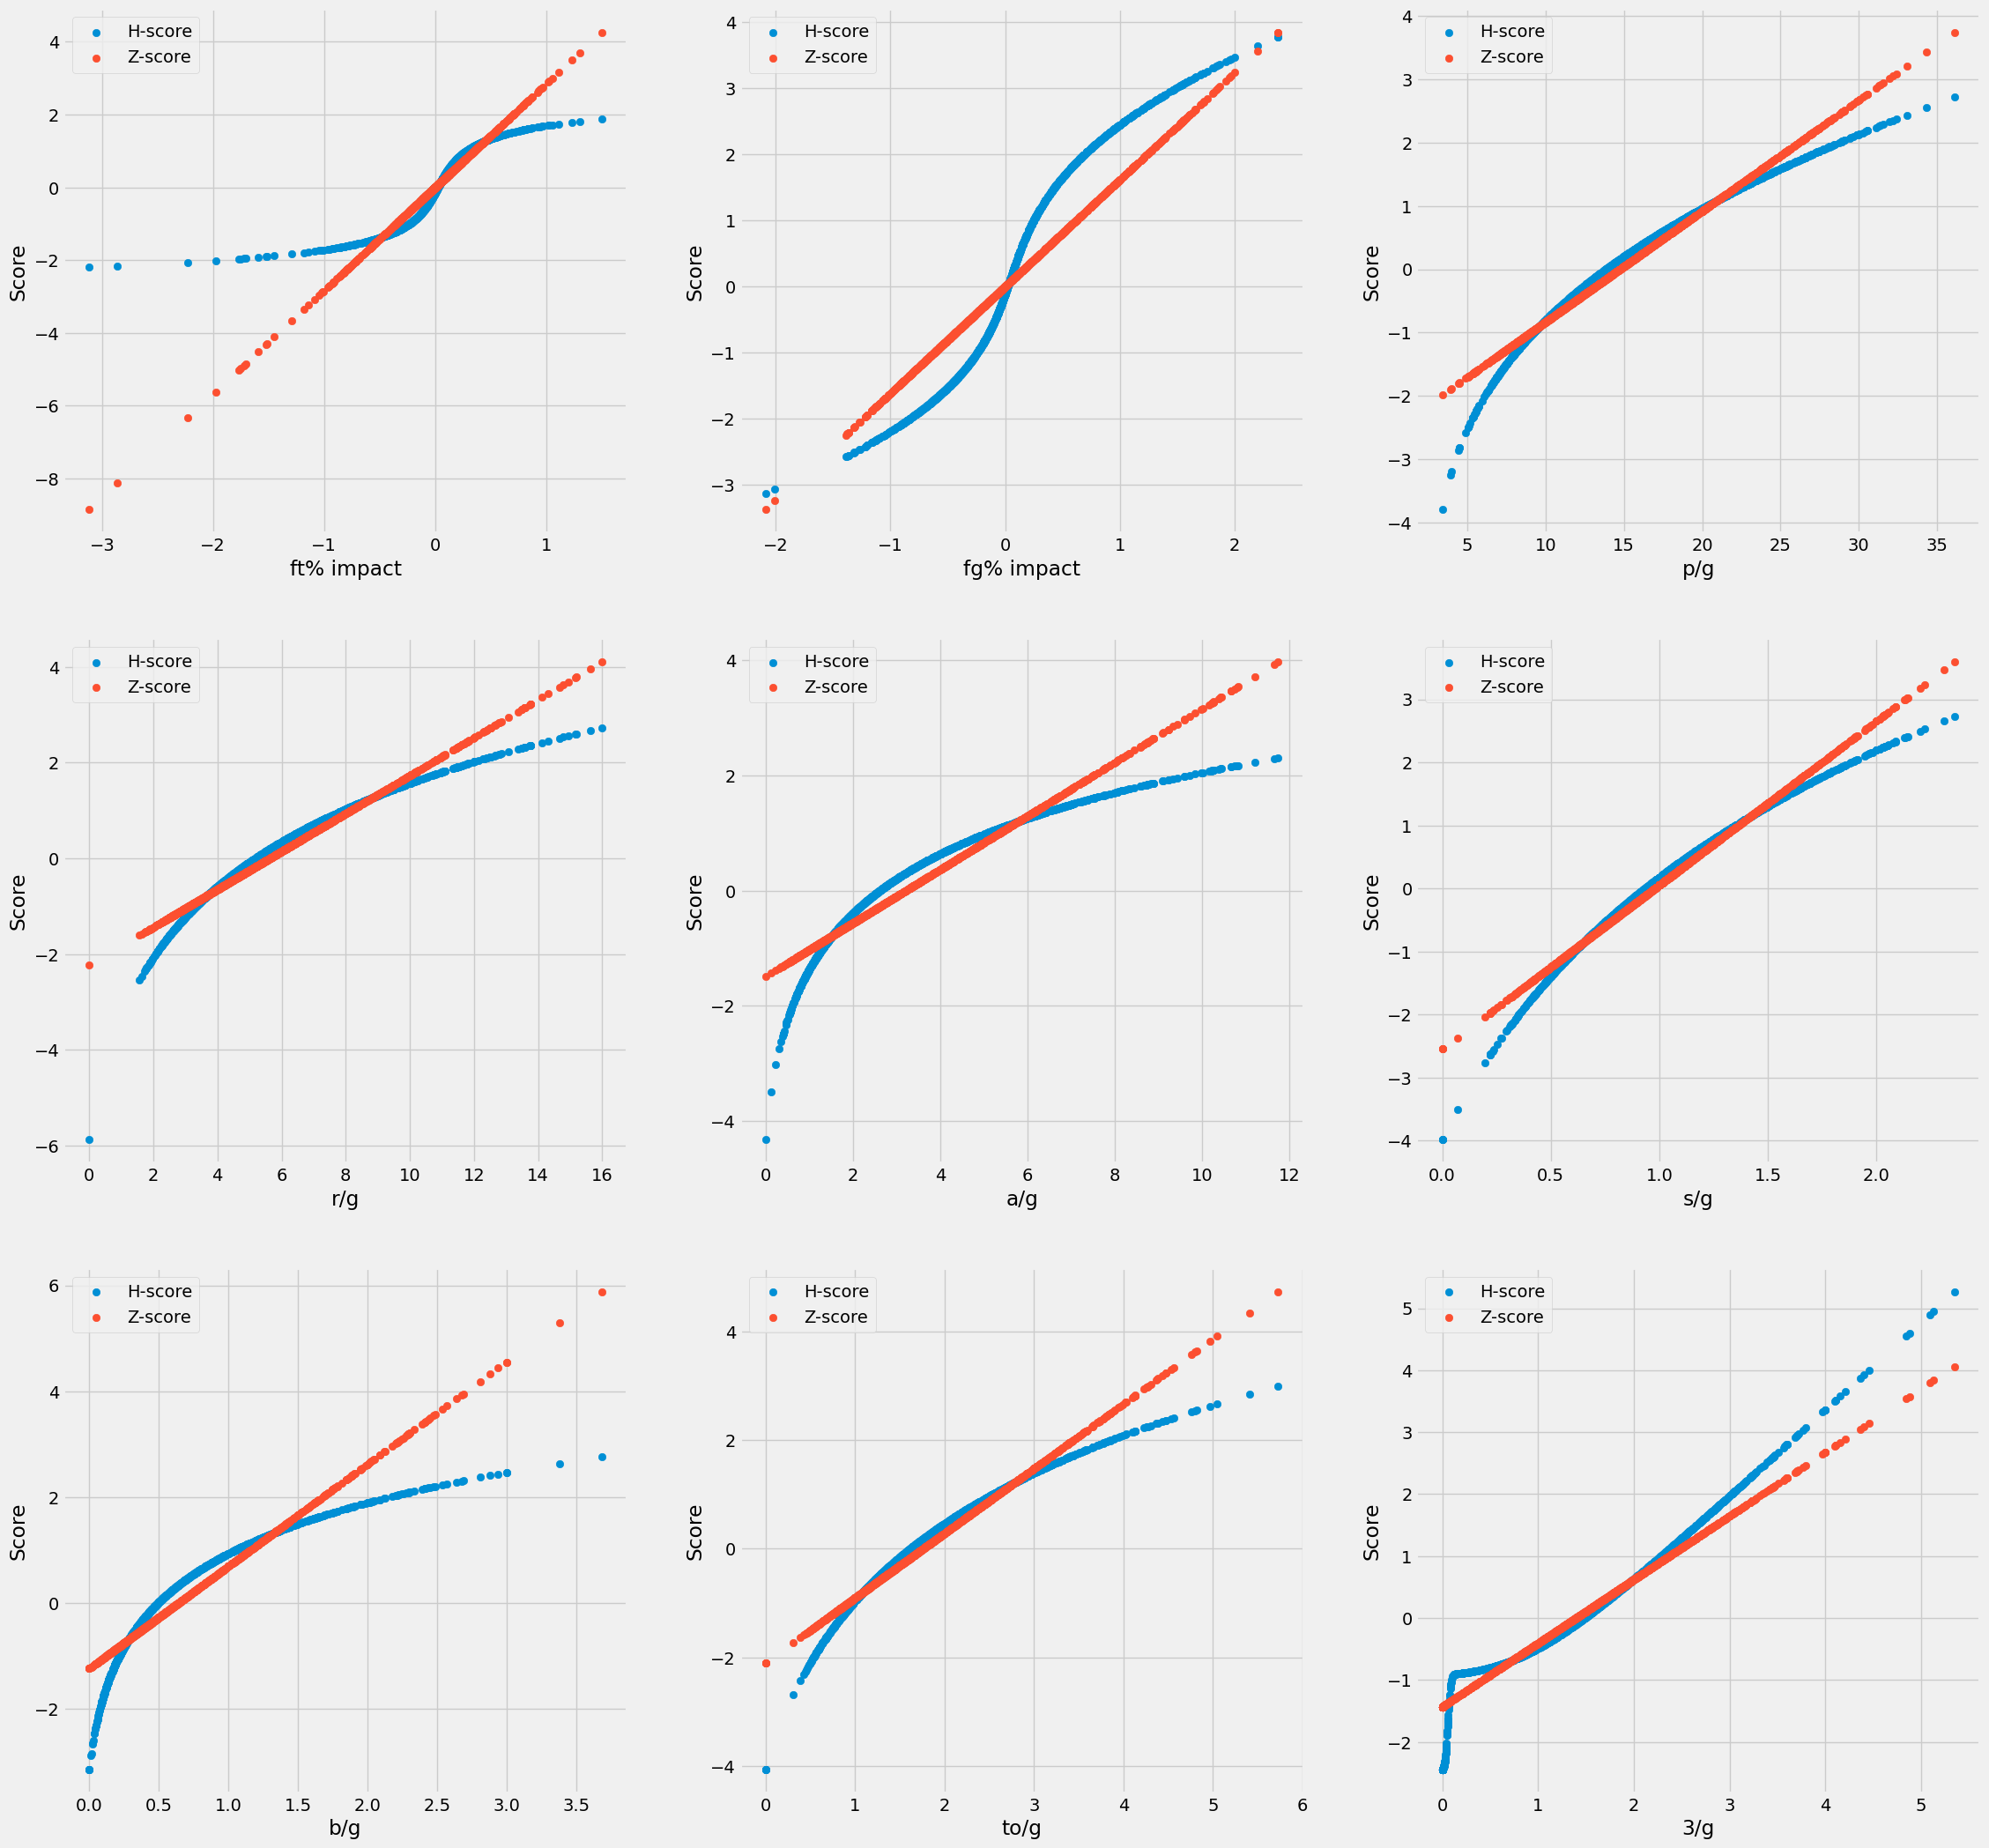
I’ve provided a lot of information, but I’ve shown very few results. In the graphs below, you can see a comparison of H-score and Z-score.
Some of the main issues that CARUSO addresses include not overvaluing high values in sparse categories like steals and blocks. This is because, as the distribution itself shows (see the image with distributions above), these categories are not as rare as the traditional Z-score suggests.
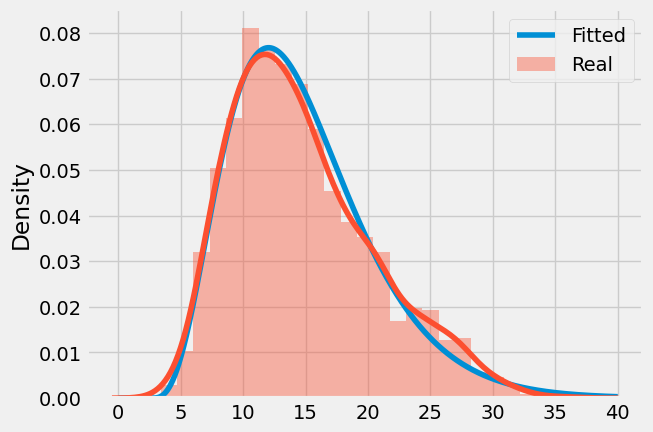
3-Pointers
Let’s delve into a specific case: 3-pointers. The unique aspect here is that it doesn’t resemble a univariate distribution; instead, it exhibits 2 spikes. As a result, it can’t be adequately fitted with the classic distribution and requires a Gaussian mixture model for accurate and logical predictions. You can see the fitted and real distributions on the left plot below.
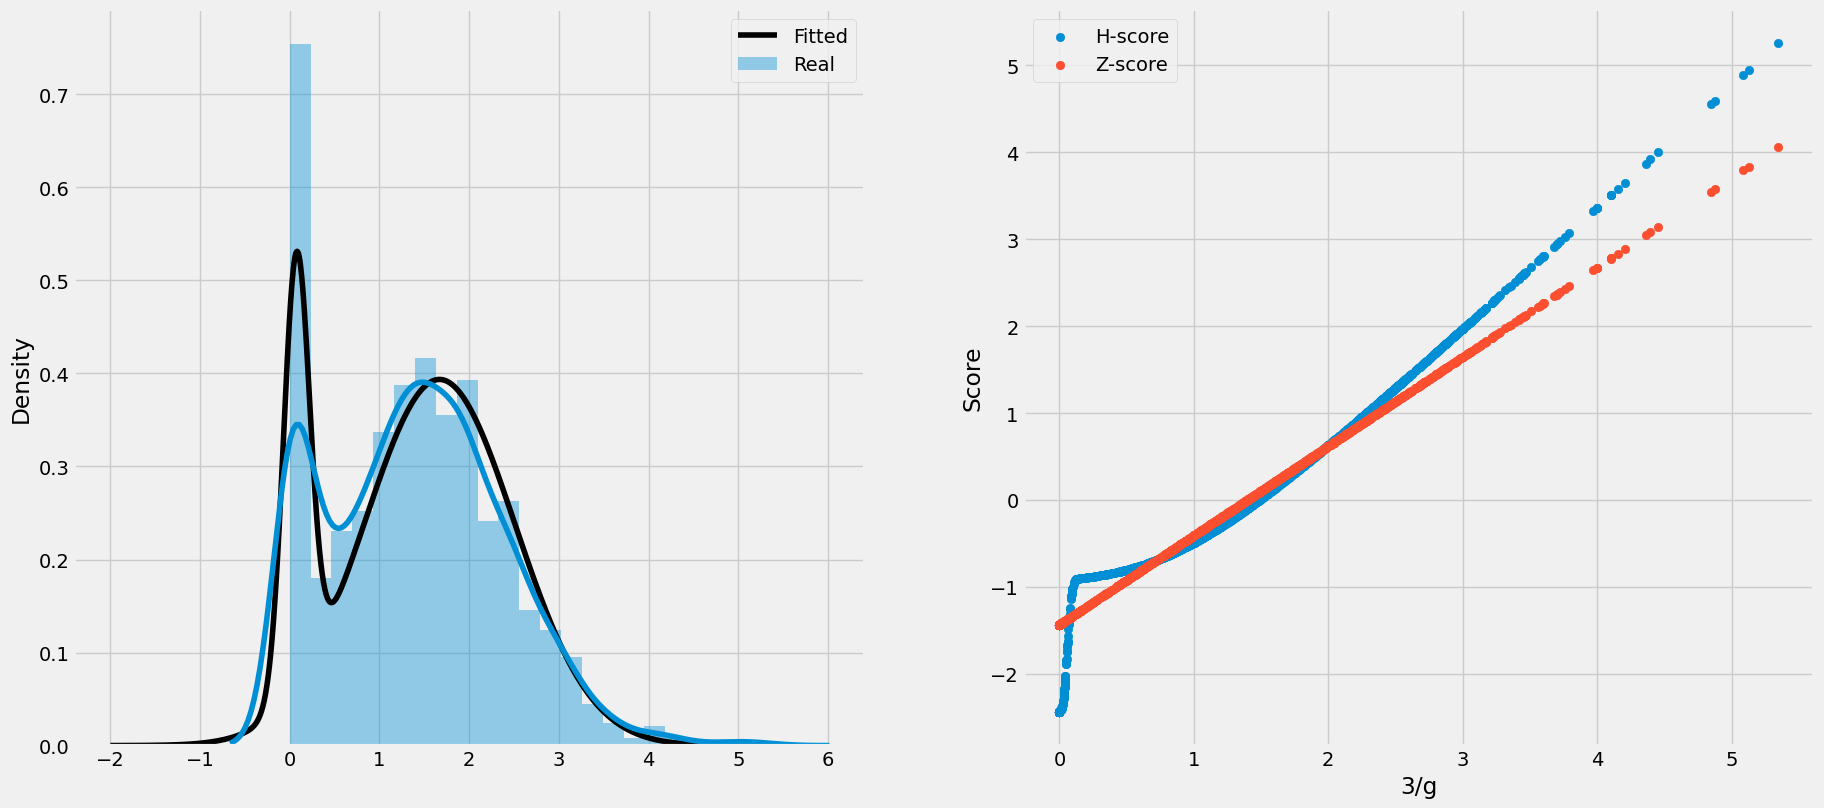
The comparison of H and Z-score for 3-pointers is particularly fascinating. Because it’s a multivariate distribution, and we have players who either take 3-pointers or don’t take them at all, CARUSO penalizes players with low 3-pointers and also rewards the most extreme cases more than the traditional approach. This finding piqued my interest, because in my mind the players that don’t score 3s at all should be punished more than players that score small volume of it. This finding will have a significant impact on the final player rankings.
Percentages categories
The aspect that posed the most significant challenge while developing the CARUSO ranking was handling the percentage categories (e.g., FG% and FT%). For this explanation, I’ll focus on FT%, but the same concept applies to FG%.
The issue with these categories lies in the lack of clear interpretability to determine which player is better:
- Player A shoots FTs at 80% on 20 attempts.
- Player B shoots FTs at 87% on 3 attempts.
Both players boast above-average FT%, but how should we score them? Let’s revisit the world of distributions (hooray!).
My initial approach involved considering both FT% and FT attempts per game simultaneously. Seemed reasonable, right? Well, not quite. In this approach, the higher the FT% was, the higher the first part of the H-score (which makes sense), and the more attempts a player had, the higher the second part of the H-score (which seemed nonsensical). For example, Player A shooting 100 attempts/game at 50% would score higher than Player B shooting 70% on 2 attempts/game, which doesn’t make logical sense. So, I moved on to the next approach.
The second method I explored was inspired by the GREAT u/nwsy96 and their Reddit comment on something called “impact.” Impact effectively considers both percentage and volume while also factoring in the mean FT% of all players. Consequently, if you perform worse than the average shooter and also take many free throws, you will be penalized! Conversely, you’ll be rewarded if you’re a better-than-average shooter with high volume. Finally, it started making sense…
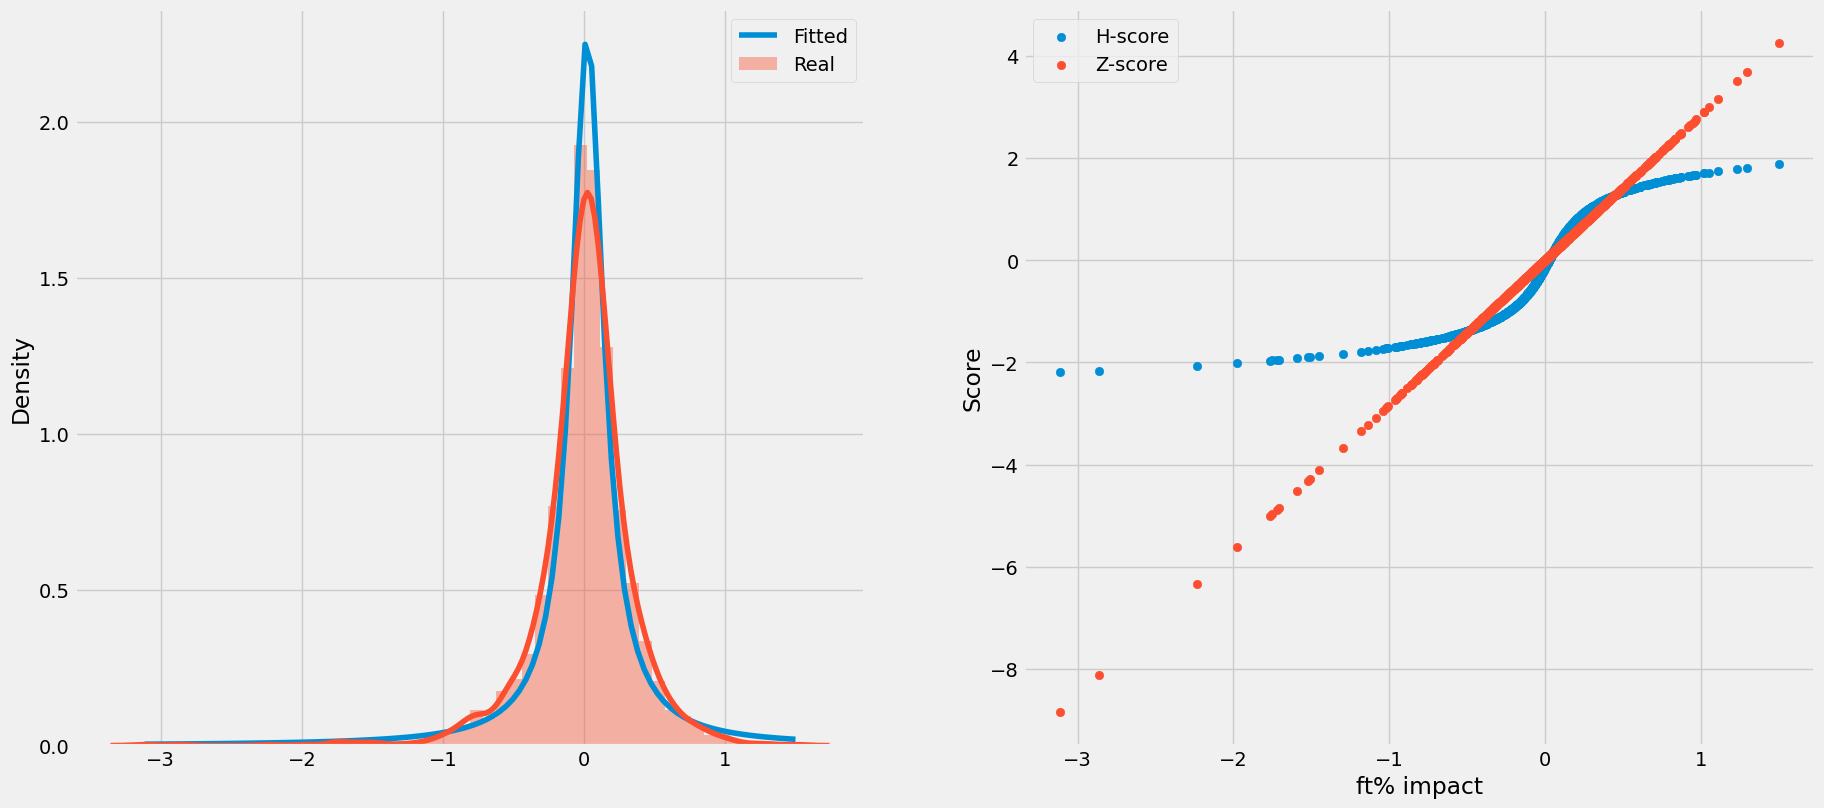
CARUSO penalizes poor percentage shooters less than traditional methods, but it also rewards elite FT shooters (and FG shooters) less. Why, you might wonder? Because that’s what the distribution tells us! <3 MATHS <3
Rankings
Here are the top30 players from last season (2022/23) based on CARUSO. Their CARUSO Rank is shown, traditional rank, changes in the rank and H-score for each category, as well as their value for the categories in question.
What is really nice that Giannis jumped up a whooping 82 spots, while JJJ dropped for 12 spots, because of the blocks distribution. Some of the other biggest movers are:
- Walker Kessler - 43 → 110 (-65)
- Chris Paul - 31 → 65 (-35)
- Mitchell Robinson - 52 → 100 (-48)
- Aaron Gordon - 122 → 63 (+59)
- Steven Adams - 173 → 129 (+43)
- Kelly Olynyk - 109 → 69 (+40)
Pretty much all of it makes sense, I would biasly say :)
Enjoy the top 30 rankings here or in the table below: